This technique adjusts the probability of your model’s prediction to match more closely with the empirical frequency of a label occurring at that given prediction, . It adjusts the probability, not the class prediction itself.
Mathematically, a calibrated model is one such that .
Model Calibration
One of the most important tests of a forecast—I would argue that it is the single most important one—is called calibration.
Nate Silver, The Signal and the Noise
Why calibrate models?
Fundamentally, we want to calibrate models to make their probabilities interpretable / grounded to the true frequency of occurrence of an event.
Doing so unlocks a few use cases:
- Probabilities can be used as confidence scores. This allows for user interpretability of the scores, as well as for model evaluation.
- It unlocks business use cases. For example, in ad click prediction, determine whether to release a particular ad if it’s expected revenue doesn’t exceed its cost.
- It keeps model changes modular, particularly in ML systems where one model’s prediction is a feature for a downstream model. In such cases, we want a given model’s prediction to truly reflect the true frequency of occurrence of an event.
Theory
A model can be calibrated but still useless.
For example, let’s think about a email spam prediction problem. If a model predicts where 10% of all emails are spam, it is calibrated, but the performance is dismal. Rather, a model that’s conditional on some covariates like and , can be calibrated and also useful.
Mathematical derivation and interpretation
An expected quadratic loss function can be decomposed as so:1
The decomposed terms represent the following:
| Terms | Description |
|---|---|
| Calibration. This is 0 for a perfectly calibrated model. | |
| Sharpness. The further away predictions are from the global average, the lower the overall loss. In some ways, this can be thought of as the variance term. | |
| Irreducible loss due to uncertainty. |
Calibration vs Sharpness
| Scenario | Description | Relation between calibration vs sharpness | Effect on quadratic loss |
|---|---|---|---|
| High variance model | Predictions are very far from the global average | Tradeoff Calibration reduces the sharpness, by pulling the scores closer towards the global average | May increase or decrease the quadratic loss |
| High bias model | Predictions are close to the global average | Decoupled. You can increase sharpness, while maintaining calibration | Loss decreases |
Effect on metrics
Calibration does not affect ranking metrics like AUC or accuracy. Such metrics only care about ordered probabilities, instead of the probabilities themselves.
Measuring calibration
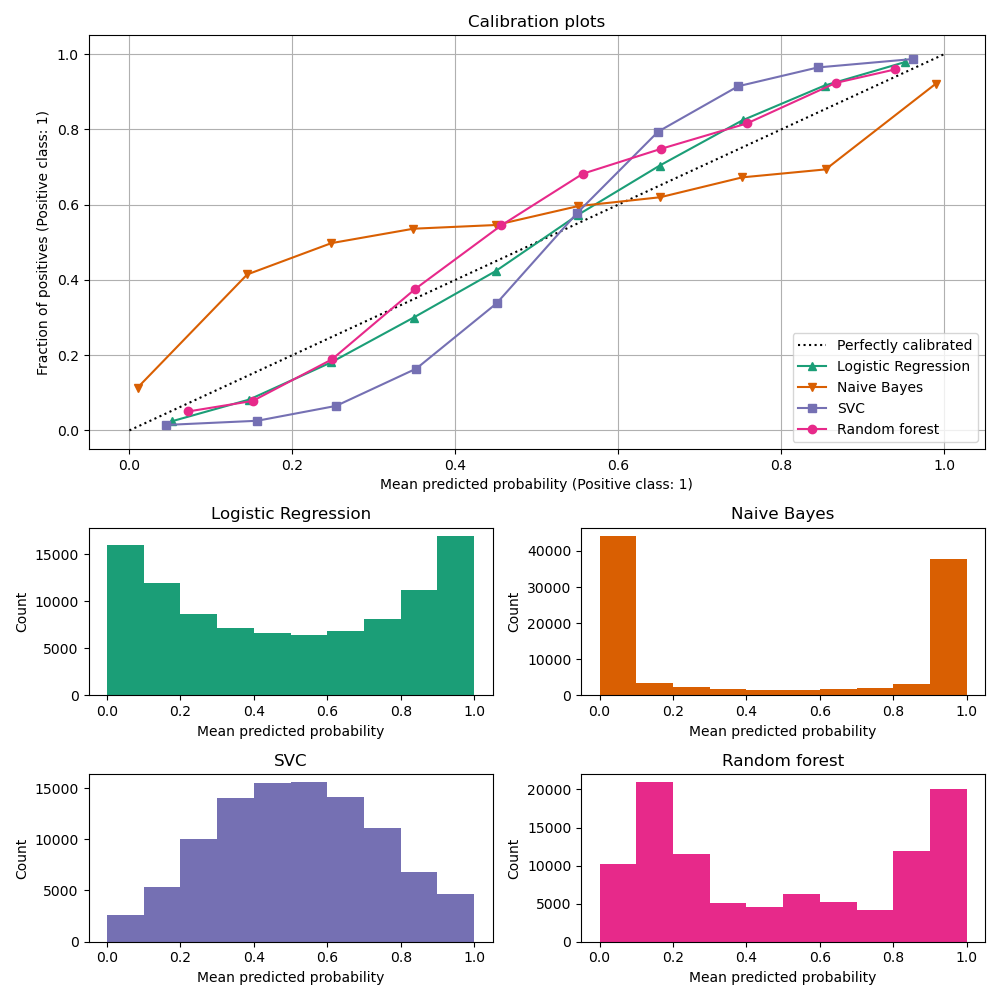
To know whether a model is calibrated, you can simply plot a calibration curve.2
Logistic regression functions tend to be perfectly calibrated IF the classes are balanced, and because their loss function maps directly to model calibration.
That said, there are many factors3 that can make a model to be miscalibrated so it’s best to assume that all models are miscalibrated to begin with.
Types of models
| Type | How to identify? | Model in example above |
|---|---|---|
| Perfectly calibrated | The diagonal line in the chart | Logistic regression |
| Under-confident model | S-shaped / sigmoid-shaped | SVC |
| Over-confident model | N-shaped / tangent-shaped | Naive Bayes |
How to calibrate a model
Use CalibratedClassifierCV in sklearn.
There’s three factors one needs to consider when using this:
Ensemble?
If ensemble=True, a clone of the estimator is fitted on each cv fold, and calibrated on the held out set. During prediction, predictions from each fold’s estimator are averaged together.
If ensemble=False, cross-validation is used to obtain held-out predictions, and a calibrator is trained on this. The result is just one estimator-calibrator pair.
| Factors | ensemble=True | ensemble=False |
|---|---|---|
| Speed | Slower | Faster |
| Accuracy | Higher | Lower |
cv=prefit?
If cv=prefit, no fitting is done—only calibration. In such a case, one needs to supply a held-out set for calibration.
Calibration method
Two options are available:
| Factors | method=sigmoid | method=isotonic |
|---|---|---|
| Parametricity | Parametric | Non-parametric |
| Dataset size | Low | Large (~1000s) |
| Limitations | - Only works on under-confident models - Requires symmetrical calibration errors - Doesn’t work on highly imbalanced datasets | - Tends to overfit on smaller datasets |
Comparison against threshold calibration
In threshold calibration, we adjust the threshold to achieve a certain precision-recall tradeoff.
This affects class predictions, but likely isn’t helpful if we care about probability interpretability.
Scaling the model post-threshold calibration to be p > 0.5 as positive labels may further miscalibrate the model.